Perform Root Cause Analysis
You can set up drift policies in various ways to help you find the root cause of problems revealed in critical and warning alerts you receive in the VIANOPS platform.
Following are some of the techniques you can use to analyze the root cause of alerts:
- RCA by multiple feature drift policies
- RCA performance drift by feature drift
- Use feature drift to reveal data quality issues
- Use segments to narrow the scope of the drift
- Use ad-hoc policies and ad-hoc runs for RCA
RCA by multiple feature drift policies
While it’s important to monitoring feature drift of production data to training data, it’s equally important to understand how the production data has been changing over time.
Changes in the real world sometimes occur quickly and sometimes slowly, like a subtle trending of waves. Some changes might be ad-hoc while others form a new weekly or seasonal pattern. Any one way of observing data may miss out the important changes. For example, if you monitor feature drift by comparing daily production data to training data, and every day a different subset of features drifts, you may not be able to get any meaningful findings. Another example is if you monitor feature drift by comparing month-to-month, the change in a weekday pattern may not be visible but it might be an important feature to model prediction.
To understand subtle changes in different scopes of your data, you can setup multiple feature drift policies with different target and baseline windows.
For more details of how to use multiple feature drift policies to understand what, when and how drift happened, please go to the free trial tutorial of sample taxi fare model.
RCA performance drift by feature drift
If you monitor model performance on daily, weekly or monthly basis, the best way to find out why model performance drops is to observe the prediction drift and feature drifts over the same time window.
Likewise with prediction drift. If you monitor prediction drift on a daily, weekly, or monthly basis, the best way to find out why prediction drifts is to observe the feature drifts over the same time window, while also considering the importance of features if it’s available.
Here are some ways to use feature drift monitoring to explain prediction drift:
-
Use statistical tests
Statistical tests, such as the KS test, can help identify changes in the distribution of input features that could impact the model’s predictions. By comparing the distribution of input features across different time periods, you can identify significant differences that could impact the model’s predictions.
-
Identify changes in feature distributions
Feature drift monitoring can help you identify changes in the distribution of input features that could impact the model’s predictions. For example, if you are monitoring a feature like temperature, then a significant shift in its min, max, percentiles could impact the model’s predictions.
-
Monitor changes in correlated features
Changes in correlations between features can also impact the model’s predictions. By monitoring changes to correlations over time, you can identify changes to the model’s predictions.
Feature drift monitoring can help explain prediction drift by identifying changes in the distribution of input features that could impact the model’s predictions.
Use feature drift to reveal data quality issues
Monitoring feature drift can help you detect data quality issues, such as missing data. Here are some ways to use feature drift monitoring to identify data quality issues:
-
Use statistical tests
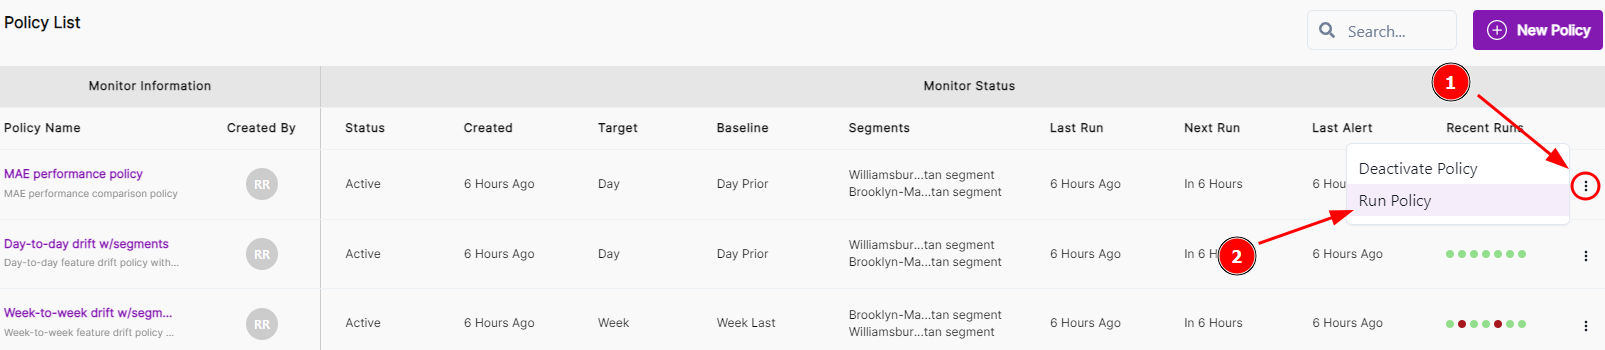
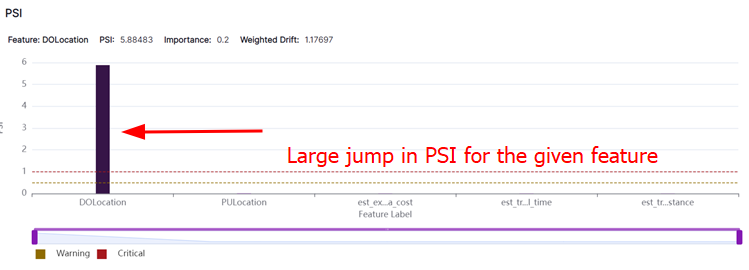
You can use statistical tests to identify changes in the distribution of features. For example, you can use the PSI or JSD to compare the distribution of a feature across different time periods. If the statistic is high, it could indicate a significant difference in the distribution of the feature that could be due to missing data. Then you can drill down into the highly drifted feature to identify the missing data. For example, if you are monitoring the age distribution of your customers and notice that the number of customers in a particular age group has decreased significantly, then that could indicate that data is missing for that age group. Or in the images below, the first image shows a critical alert, while the second shows that a feature has a large jump in PSI, and the third confirms that data is missing for that feature on the given segments.


-
Monitor Correlations
Correlations between features can also help you identify missing or incomplete data. If two features are highly correlated, and one feature’s distribution has shifted significantly while the other one’s distribution hasn’t, it could indicate that some data is missing for the feature that has shifted.
-
Visualize Data
Visualization techniques such as histograms, density plots, and scatter plots can help identify missing data. For example, if you are monitoring the distribution of a feature across different time periods and notice that there are gaps in the histogram, it could indicate that some data is missing.

Use segments to narrow the scope of the drift
Segments are sub-sections of a data set. Setting up a policy on a segment can uncover patterns for that segment that do not appear in the overall data set.
For more details of how the segments can be used to narrow down the scope of drift, please go to the free trial tutorial of sample taxi fare model.
Use ad-hoc policies and ad-hoc runs for RCA
When you create a policy, you specify a schedule for that policy to run at regular intervals. If alerts begin coming in outside that scheduled time frame, you can run a policy manually to check immediately for causes of drift.
When performance drops or predictions drift, the existing policies are not able to discover the potential causes; you can always set up a new policy with different target/baseline windows or other settings, and use Run Now to immediately run the analysis to get a different dimension of observation.
To run a policy manually, find the policy in your policy list, click the three dots at the far right of the row, and click Run policy.