Monitor your model
Risk types and policy overview
Machine learning models are different from traditional enterprise software as they are dynamic and their performance can fluctuate over time due to changes in the input data. This may lead to unexpected behavior, such as biased predictions or degradation in model performance. Therefore, it is essential to monitor machine learning models in production to detect and mitigate any potential model risks before they result in financial or reputation loss.
Model performance metrics, such as Accuracy, Precision, Recall for classification models or Mean Absolute Error (MAE), Mean Squared Error (MSE) for regression models, are direct indicators to monitor model risks. However, in some cases, ground truth may not be immediately available in production. In such scenarios, monitoring changes in input features and output prediction distributions can be used as a leading indicator and troubleshooting tool for performance issues.
VIANOPS supports monitoring different types of risks, including Performance drift, Feature drift, and Prediction drift. Policies define a process to monitor and alert users when drift happens, and they include configurations such as target & baseline windows, drift metric, alert thresholds, running schedules, selected segments, and selected features. Multiple drift policies with different settings can be defined to monitor models from different dimensions.
Type of risks supported by VIANOPS:
- Performance drift: Changes in the performance metrics of a model between target window and baseline window.
- Feature drift: Changes in the value distribution of a feature in a target time window with respect to the baseline window. For example, feature drift of trip_distance this month comparing to last month.
- Prediction drift: Changes in the value distribution of predictions made by the model between target window and baseline window.
For detailed information on how to create a new policy, please refer to the following link: Create a policy For detailed information on how to view the policy dashboard, please refer to the following link: View Policy dashboard
Create monitoring policies
In VIANOPS, policies can be created using the SDK or REST API, or directly through the user interface. Policies are tied to a specific model and run against the inference data. Therefore, it is important to ensure that the model and inference data have been properly ingested into VIANOPS before creating a policy.
For detailed information on how to create a new policy, please refer to the following link: Create a policy
View model dashboard
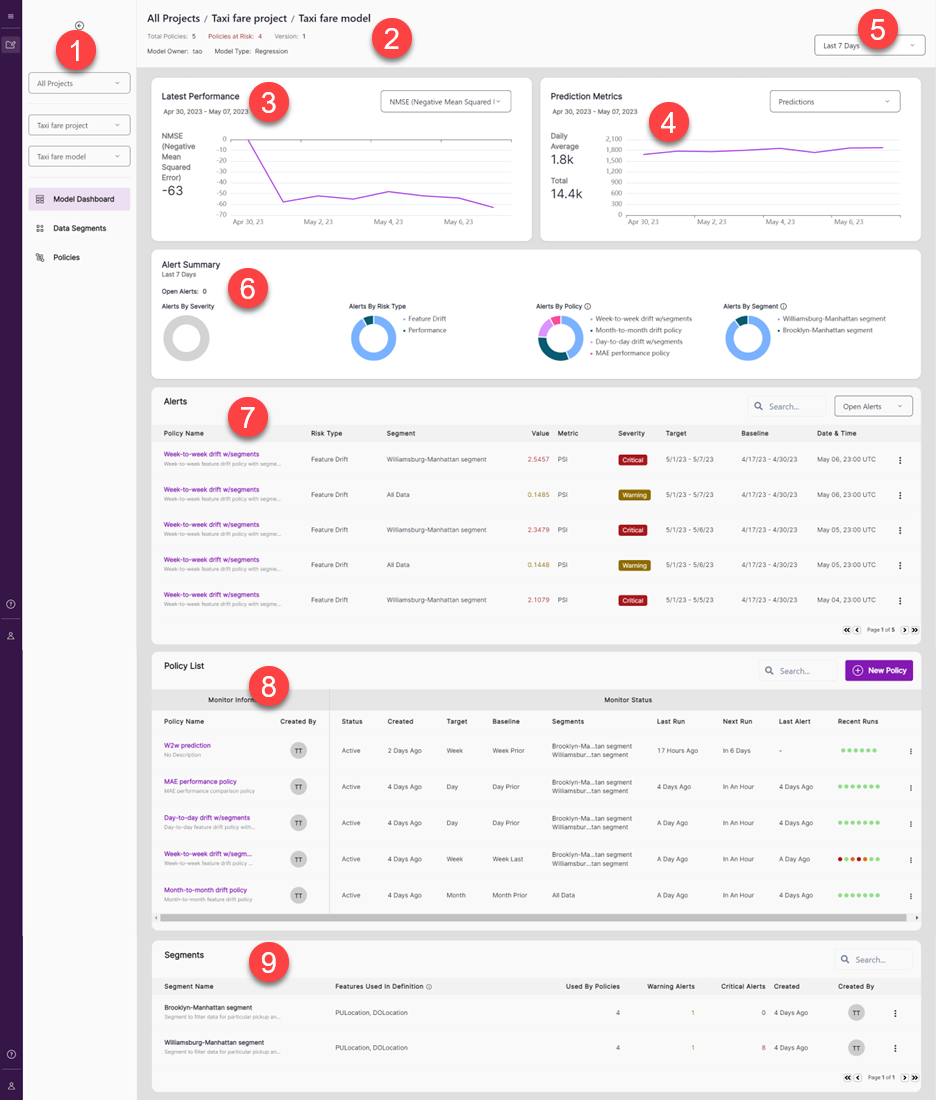
In VIANOPS, the Model Dashboard is the main user interface that provides an overview of the model’s status. To access your model’s dashboard, select the appropriate project and model on the left navigation bar (Section 1 on the screenshot).
The Model Dashboard is divided into several sections that offer different information about the model:
- The Header (Section 2) displays the model path and metadata such as the model owner, type, version, and the total number of policies.
- The Latest Performance section (Section 3) displays the latest performance trend over the last seven days by default, but you can choose different performance metrics based on the model type.
- The Prediction Metrics section (Section 4) displays the inference traffic trend over the last seven days by default.
- You can select a longer time horizon, such as the last 30 days, last 90 days, or last 6 months, from the time drop-down list (Section 5) to view the model’s performance over a longer period.
- The Alert Summary (Section 6) provides the total number of alerts, as well as the distribution of alerts by severity, policy type, policy, and segment.
- The Alerts List (Section 7) displays individual alerts. You can sort the alert list by any column and filter alerts by status.
- The Policy List (Section 8) displays all policies created for this model, and Recent Runs indicate whether any alert was triggered from the last runs.
- The Segments List (Section 9) displays the segments defined for monitoring in some of the policies.
View policy dashboard
For more information on viewing the policy dashboard, see View policy dashboard
Alert management
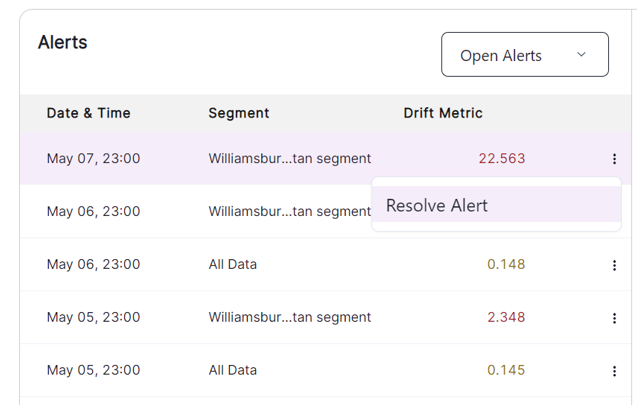
The Model Dashboard displays all alerts triggered by policies created for the model, whereas the Policy Dashboard only displays alerts triggered by the specific policy. Whenever a policy runs and detects a violation, meaning the measured drift metric exceeds the warning or critical threshold, it triggers an alert with a corresponding severity level.
If you want to clear an alert after diagnosing it, you can click on the three dots next to the alert in the alert list and select “Resolve Alert”. This action moves the alert from the open list to the resolved list.