
View policy dashboard
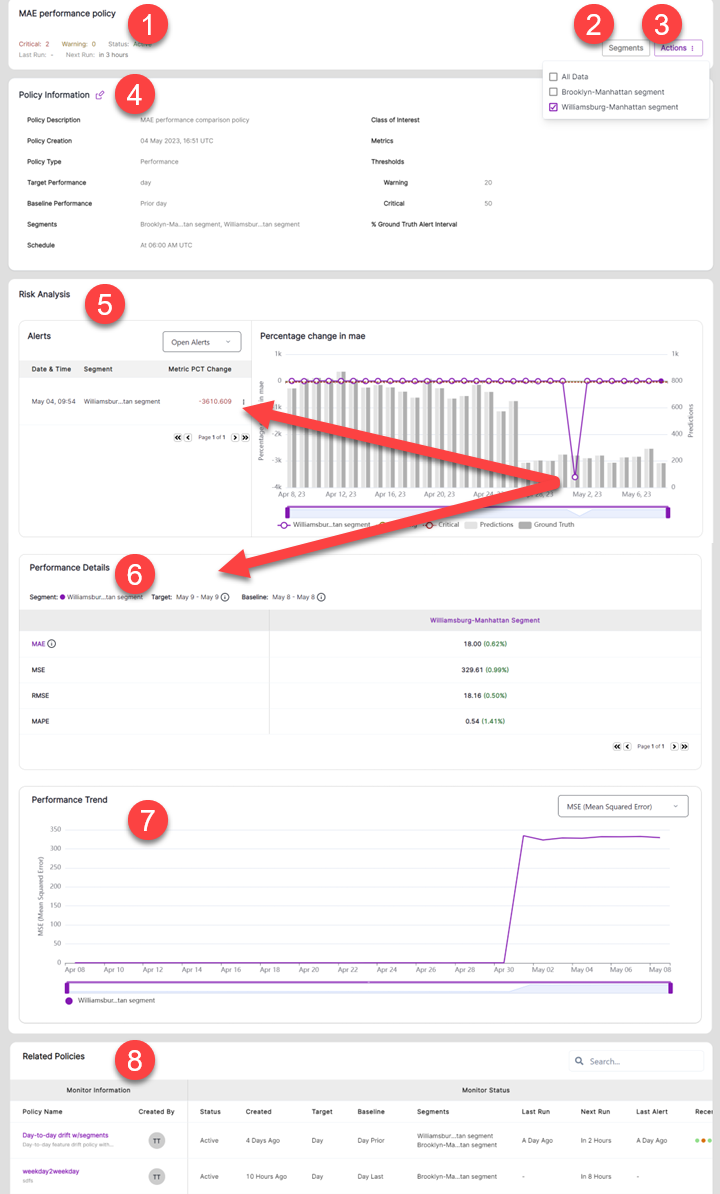
The Performance Drift Policy Dashboard provides a comprehensive view of the model performance’s day over day change. Here’s a breakdown of the different sections:
- Header: This section displays the policy name, the total number of critical or warning alerts, the activation status, and the schedule of the last and next runs.
- Segment Selection: This section allows you to select specific segment(s) to view the dashboard for those segments in the policy.
- Actions: This section allows you to activate or deactivate the policy, or run the policy on-demand.
- Policy Information: This section displays the policy’s configuration, including the policy description, creation time, policy type, target window, baseline window, selected segments, and schedule.
- Risk Analysis: This section shows the list of alerts and drift metric trend over time. You can click on the circle in the right chart to highlight the corresponding alert in the alerts list on the left.
- Performance Details: Clicking the circle in the Risk Analysis section will automatically refresh the Performance Details section.
- Performance Trend: This section shows the trend of the actual model performance over time. You can select other performance metric based on the model type.
- Related Policies: This section lists the most relevant policies in order, allowing you to quickly jump to another policy to further investigate potential root causes.
The Feature Drift Policy Dashboard provides a comprehensive overview of the features monitored in a policy, including the individual feature drift and the overall feature drift at the policy level. Here is a detailed breakdown of the various sections:
- Header: This section displays the policy name, the total number of critical or warning alerts, the activation status, and the schedule of the last and next runs.
- Segment Selection: This section enables you to choose specific segment(s) to view the dashboard for those segments in the policy.
- Actions: This section enables you to activate or deactivate the policy, or run the policy on-demand.
- Policy Information: This section displays the policy’s configuration, including the policy description, creation time, policy type, target window, baseline window, selected segments, and schedule.
- Risk Analysis: This section provides a list of alerts and the overall feature drift trend over time. By clicking on the circle in the right chart, you can highlight the corresponding alert in the alerts list on the left.
- Drift per Feature: When you click on the circle in the Risk Analysis section, the Drift per Feature section will be automatically refreshed. This section lists all the selected features monitored in this policy and visualizes their drift level in a bar chart or plot on the right side of this section.
- Value Distribution: By clicking on a feature in the Drift per Feature section, the value distribution of the selected feature between its target window and baseline window will be automatically refreshed.
- Drift Trend: This section will also be refreshed when you click on a feature in the Drift per Feature section. It shows the trend of the selected feature’s drift over time. You can select other drift metrics to observe the trend.
- Related Policies: This section lists the most relevant policies in order, enabling you to quickly jump to another policy to further investigate potential root causes.
The Prediction Drift Policy Dashboard provides similar view as Feature Drift.
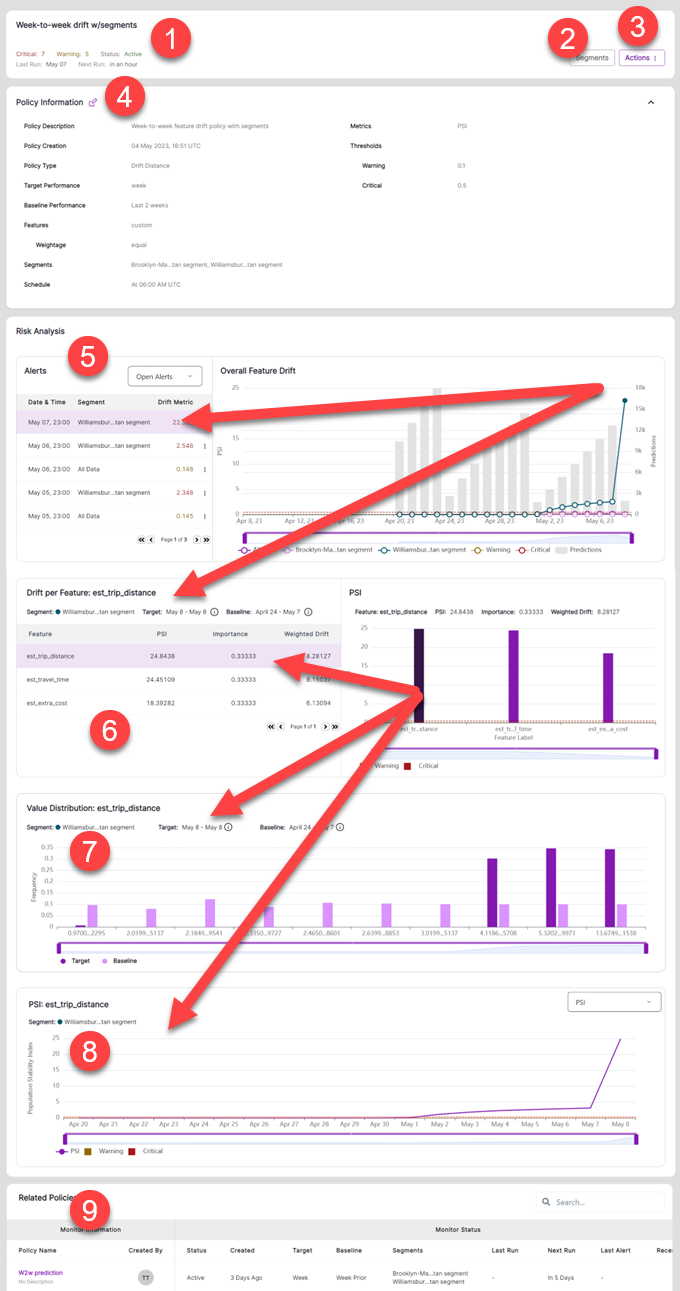
TABLE OF CONTENTS