Hotspot analysis
A hotspot is a specific area or region within a dataset where an event occurs more frequently or shows a higher value compared to the surrounding areas.
Hotspot analysis is a technique that identifies hotspots within a dataset.
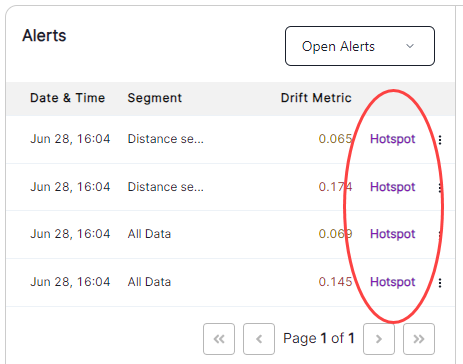
In VIANOPS, any alerts that show drift (either feature drift or performance drift) on a feature that you have set up to have hotspot analysis appears in the Policies > Risk Analysis > Alerts pane with a Hotspot link.

-
To set up your features to have hotspot analysis, see API - Hotspot Analysis.
-
Click the Hotspot link to open the Hotspot Analysis window.
Hotspot analysis window
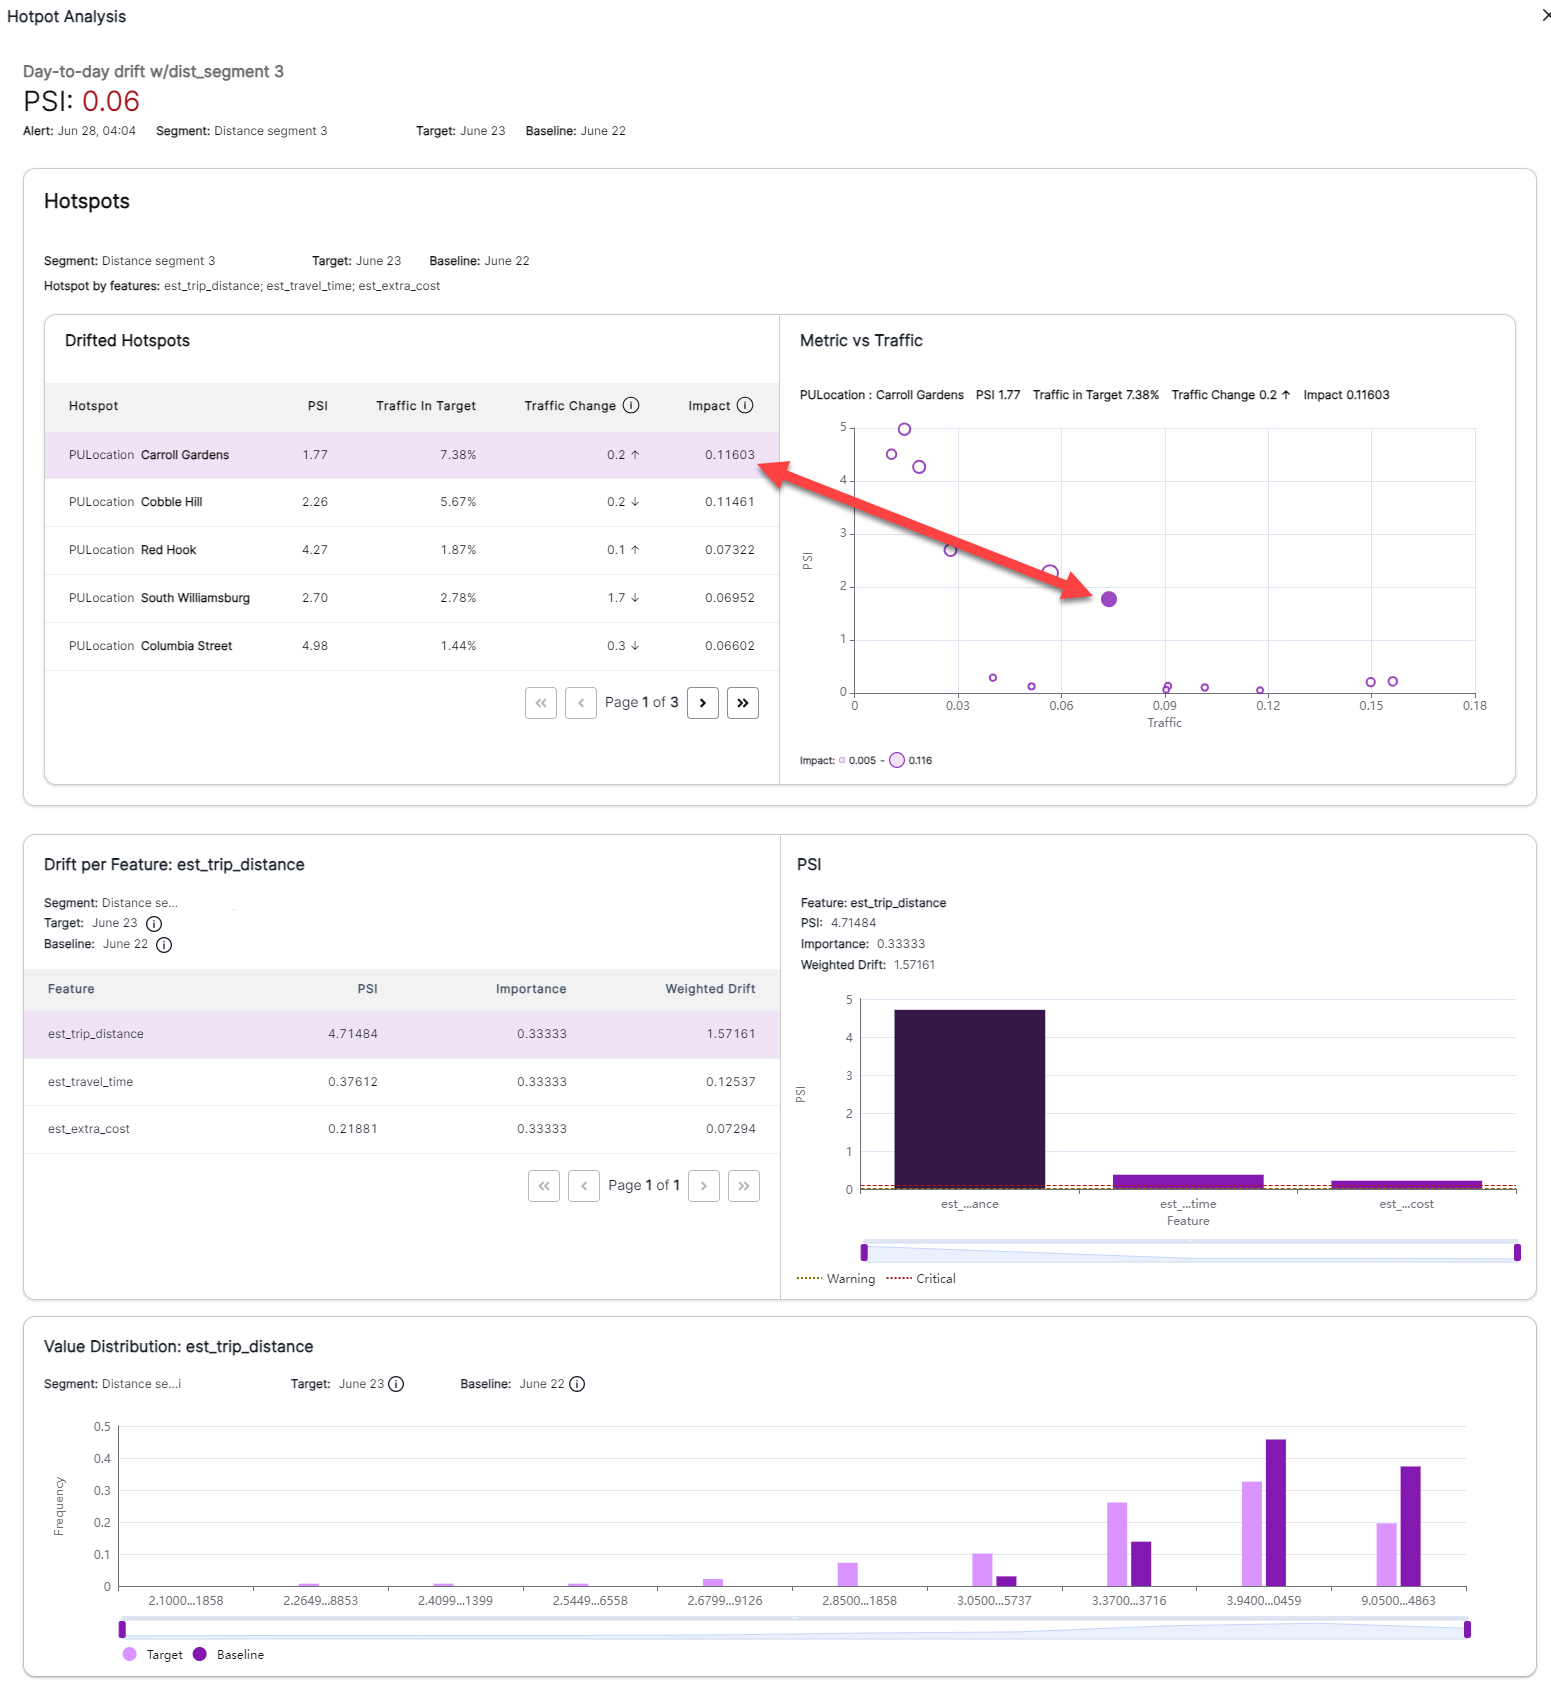
The Hotspot Analysis window contains the following panes:
- Hotspots — Lists the drifted hotspots and shows a graph of PSI against Traffic for the selected hotspot.
- The items in the list cross-link with the circles in the graph.
- The size of the circles in the graph are relative to the impact.
-
Drift per Feature — The same pane as the Drift per Feature pane in the profiles window. Shows drift per feature in a list and graphs PSI for that feature.
- Value Distribution — The same pane as the Value Distribution pane in the profiles window. Shows the distribution of values against frequency.


