Explainability
VIANOPS currently supports explainability in two ways:
- Feature importance across the full dataset (Global explainability)
- Feature importance for a single row (Local explainability)
Feature importance across the full dataset
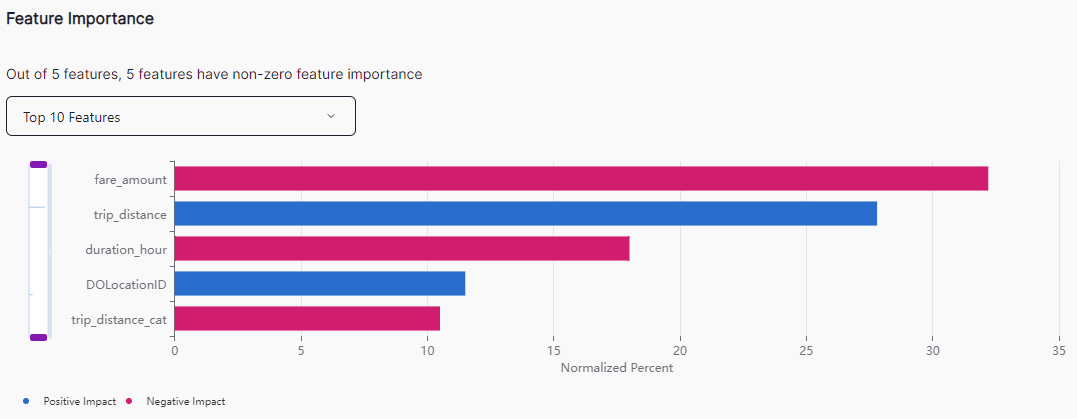
Uploading data
To upload feature importance data, you can either send a JSON object through the API or upload a file. The JSON object definition and the file format are described in the Feature importance topic of the API reference manual. (The image above shows the results of the example given in the API reference manual.)
UI elements
The VIANOPS model dashboard shows the feature importance data as in the image above with the following elements:
- Top X features dropdown — select to show the top 10 features, top 20 features, or all features with importance.
- Scope sliders — narrow the range of the graph to a subset of contiguous features.
- Graph of SHAP values — The features with positive impact appear in red while those with negative impact appear in blue. The length of each bar represents the normalized percentage of importance for that feature.
Feature importance for a single row
To run feature importance on a single row:
-
Import the training data for the model.
-
Add the following tag to the
model_tags_payloadobject in the notebook just before the model tag mapping the training data:{ "name": "predict_metadata", "value": { "model_class": "MODEL_CLASS", "model_url": "MODEL_URL", "train_cols": "[LIST_OF_COLUMNS]" }, "status": "active" }For example, from the taxi fare notebook:
{ "name": "predict_metadata", "value": { "model_class": "vianai.explainability.local_predict_wrapper.LocalPredictWrapper", "model_url": "/models/taxi_model/taxi_model.pkl", "train_cols": "['PULocation', 'DOLocation', 'est_trip_distance', 'est_travel_time', 'PUweek', 'PUsin_day', 'PUcos_day', 'PUsin_day_month', 'PUcos_day_month', 'PUcos_hour', 'PUsin_hour', 'est_ride_cost', 'est_extra_cost', 'mta_tax', 'tip_amount', 'tolls_amount', 'improvement_surcharge']" }, "status": "active" } -
When you run the notebook, VIANOPS creates the model and starts the Explainer model to serve the feature importance data for rows. Use the Explainer window in VIANOPS UI to view the feature importance info for a selected row.
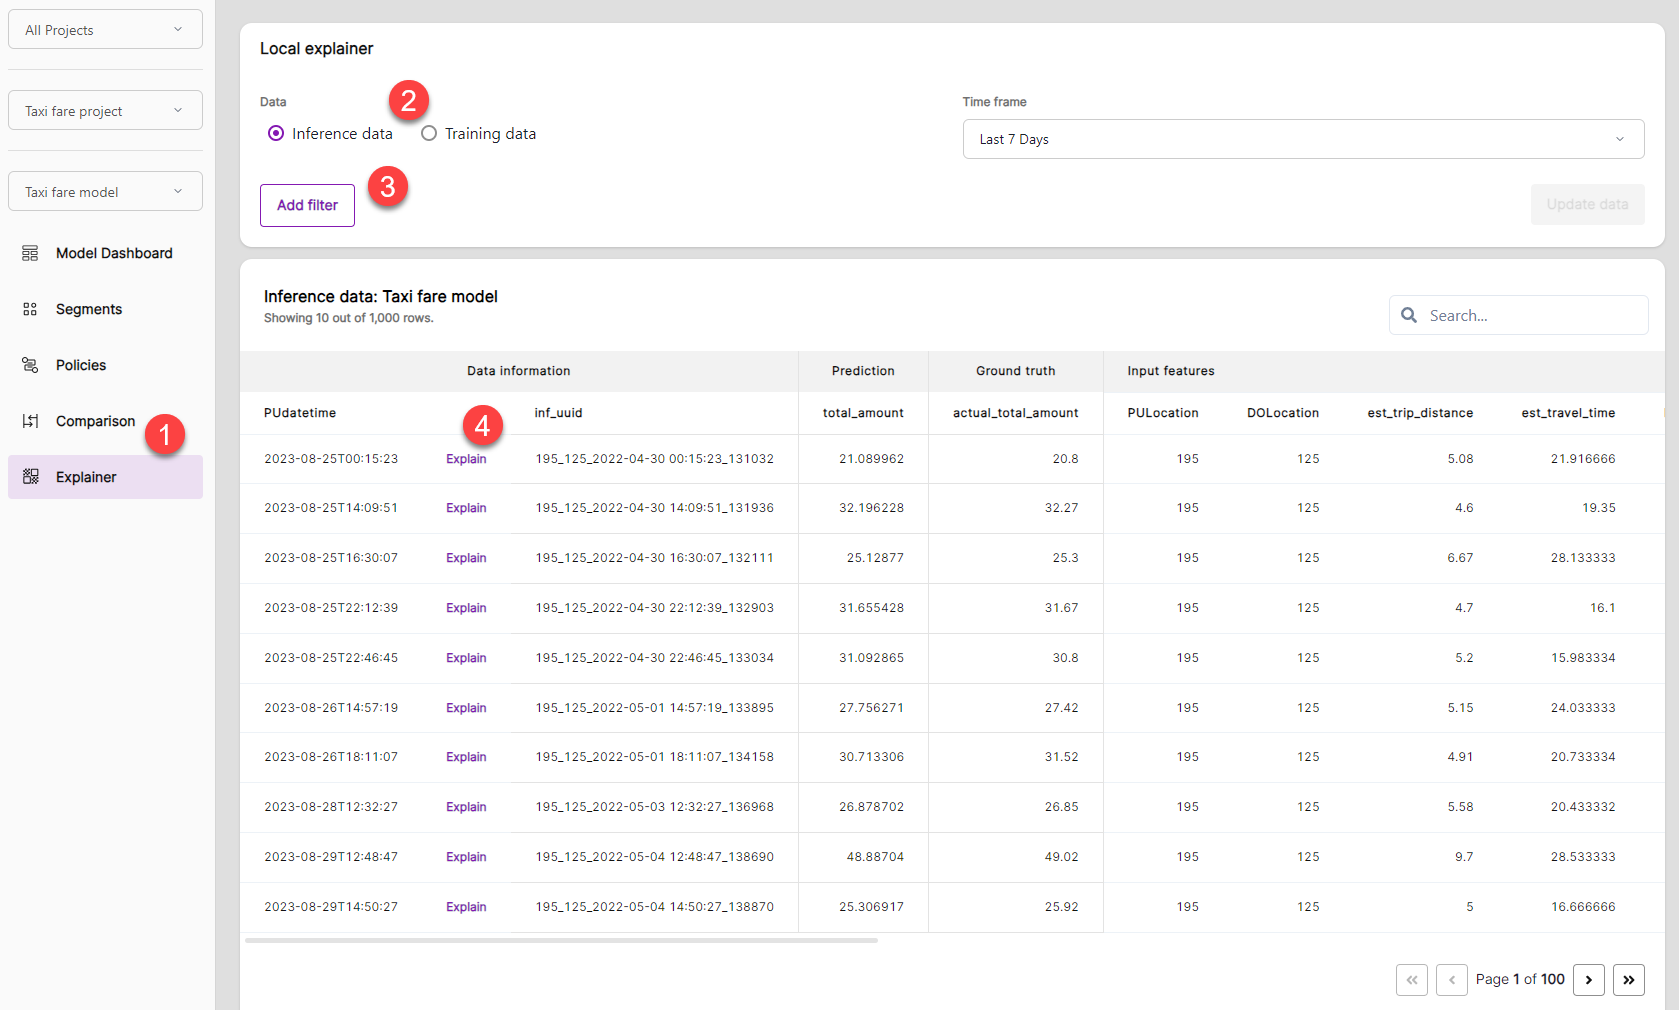
Explainer window in VIANOPS UI
-
Select Explainer from the Model Dashboard.
-
Select either Inference data or Training data.
-
Click Add filter to open the Edit filter window where you can narrow the number of rows available. See Edit filter window
-
Click Explain for a given row to view the feature importance for that row and to perform what-if analysis. See Local explainer window
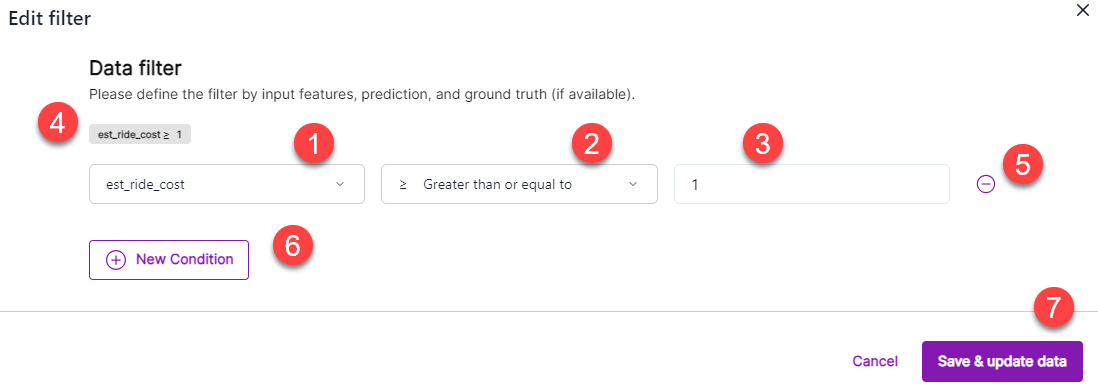
Edit filter window
-
Select a feature.
-
Select an operator.
-
Add values for the condition. Separate multiple values with a semicolon.
-
After you fill out the condition, an equation with a gray background appears above the list of conditions. If you define multiple conditions, each condition has an equation represented here.
-
To delete a condition, click the circled dash at the far right of the condition.Delete condition.
-
To add a new condition, click Add new condition.
-
When you have finished defining conditions, click Save & update data. The Edit filter window goes away revealing the Explainer window with the rows filtered by the conditions you have defined.
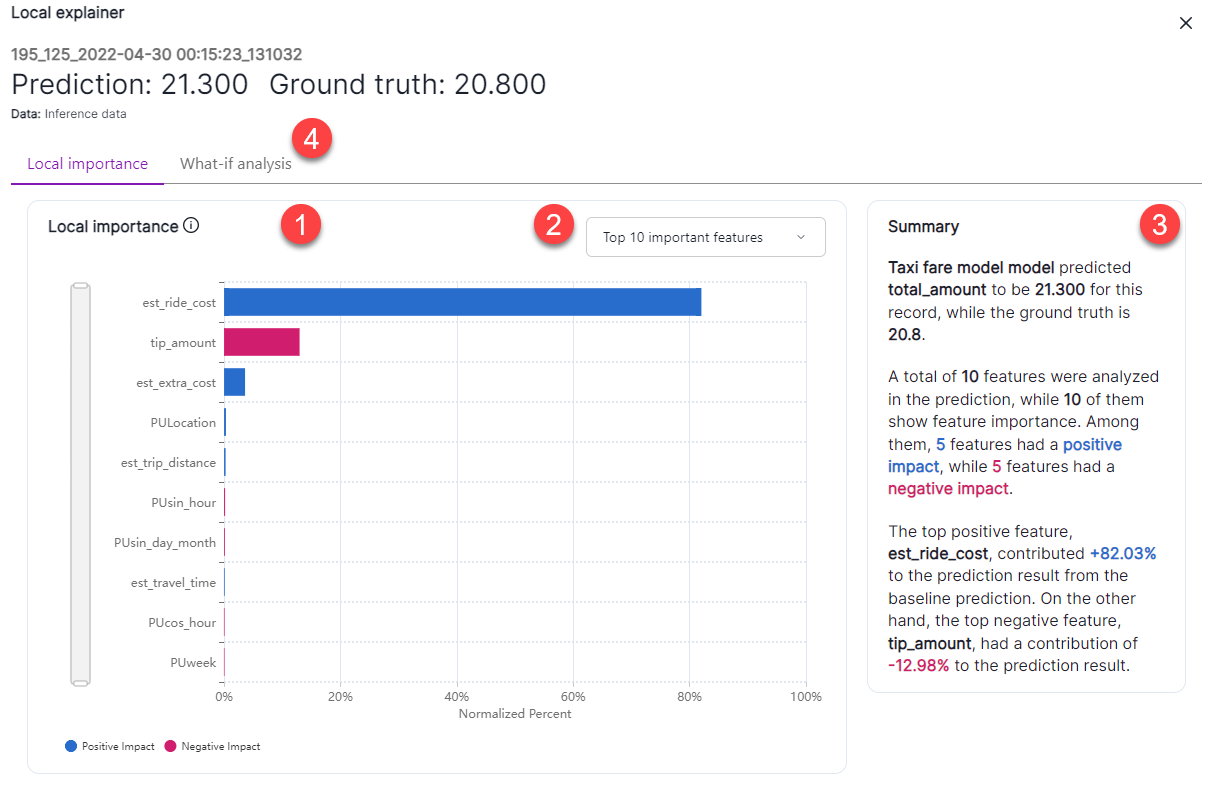
Local explainer window
The Local explainer window has two tabs: Local importance (default) and What-if analysis.
-
Local importance tab
The local importance for the selected row has the following elements:
- A graph showing the Normalized percent impact for each feature.
- Select a window of features with the slide bar on the left.
- Positive impacts appear as a blue bar and negative red.
- Select the following number of features:
- Top 10 important features
- Top 20 important features
- All features with importance
-
A text summary of the feature importance for the selected row.
- Link to the What-if analysis tab.
- A graph showing the Normalized percent impact for each feature.
-
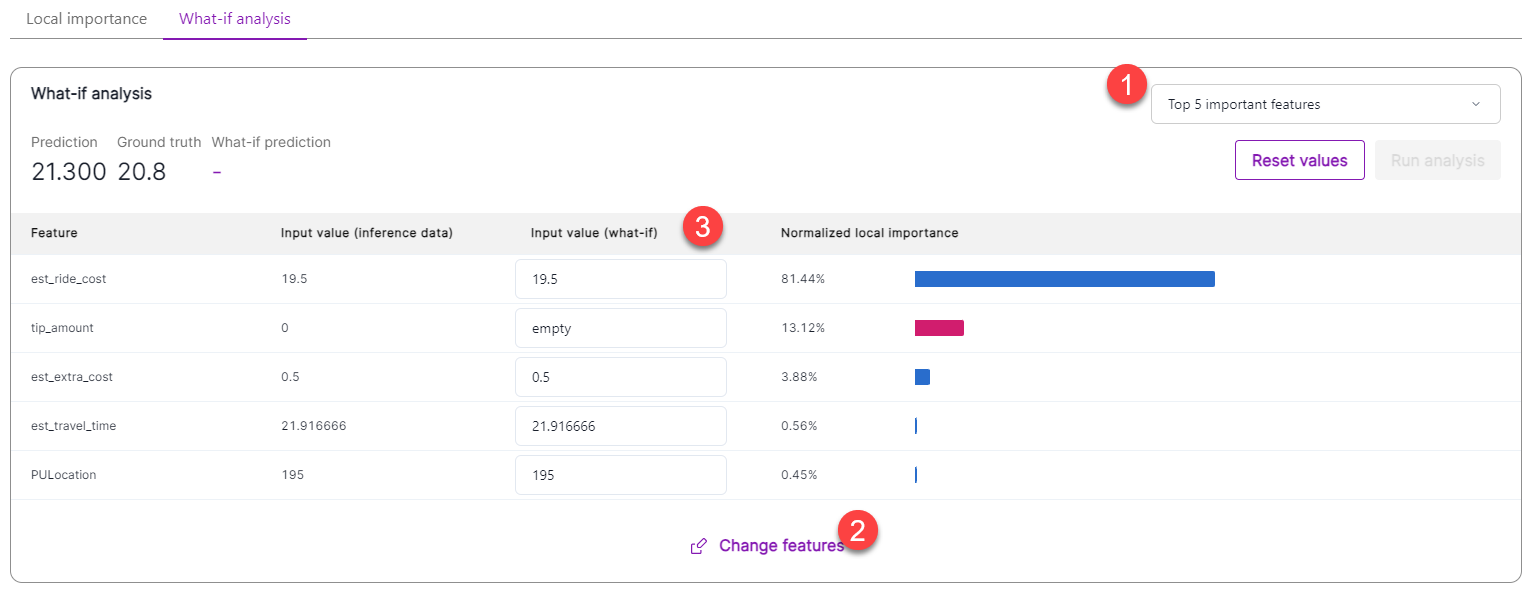
What-if analysis tab
- Select the following number of features:
- Top 5 important features
- Top 10 important features
- Top 20 important features
- All features with importance
-
Click Change features to select the features that appear for what-if analysis.
-
Change the values of features in the Input value column.
-
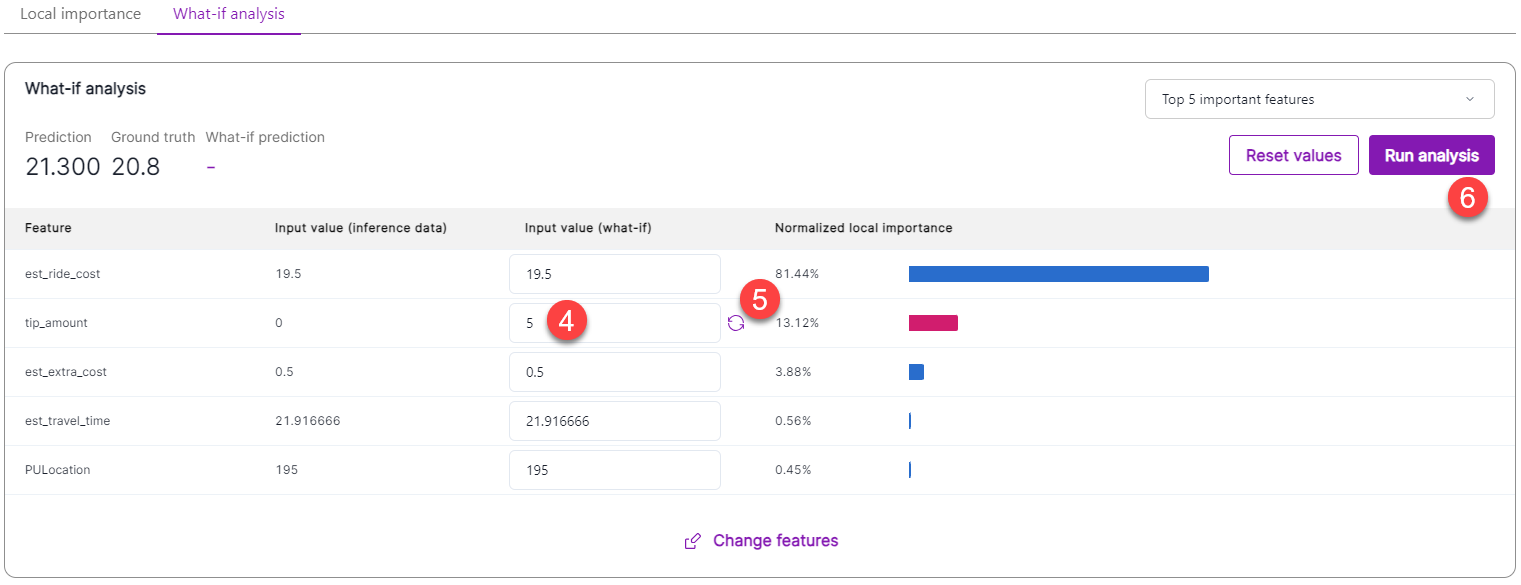
For example, here we updated tip_amount to 5.
-
Rotating circles indicate the value has changed. Click to reset the value.
-
Click Run analysis. This button is not enabled until you change a value.
-
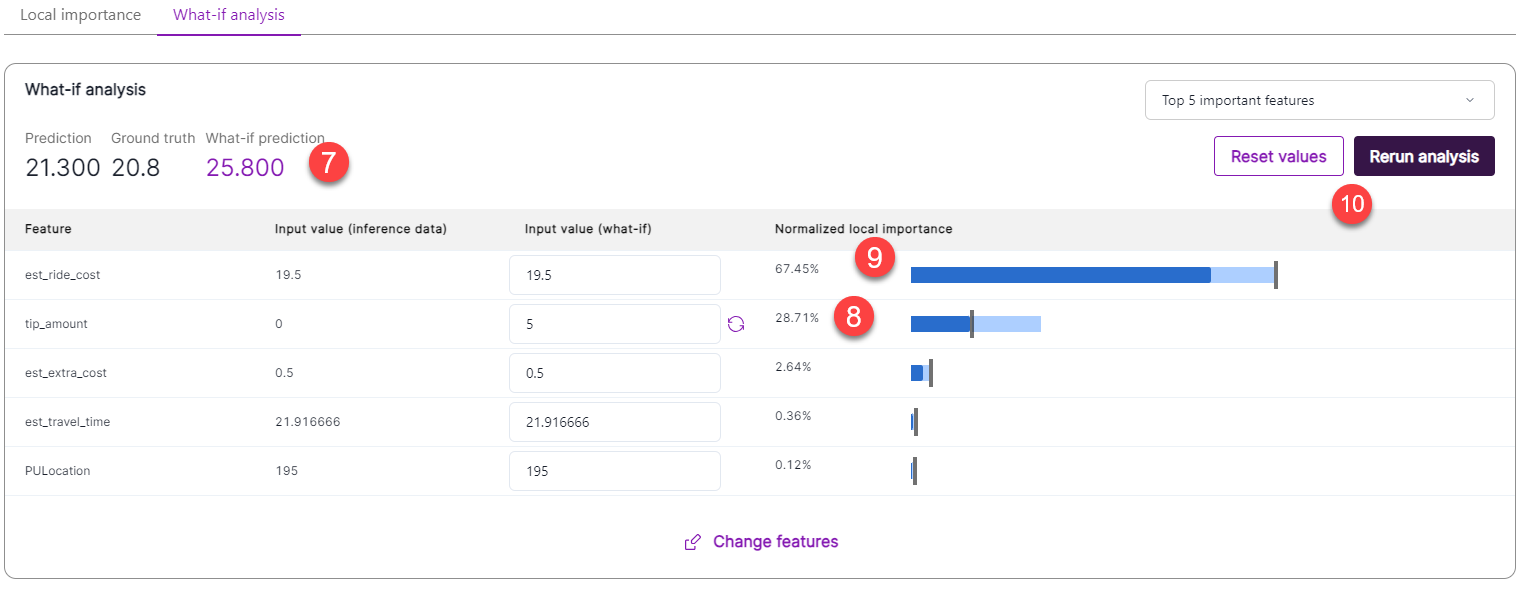
The What-if prediction value updates.
-
The Normalized local importance value for the feature updates. The gray bar in the graph indicates the original value.
-
The other features have their values changed accordingly.
-
You can make additional changes and Rerun analysis.
- Select the following number of features:

